In the world of digital infrastructure, few abbreviations carry as much weight as PUE. For over a decade, Power Usage Effectiveness has been the industry’s primary benchmark for efficiency, comprising a simple ratio of the total electricity consumed by a facility divided by the electricity used by its IT equipment. Despite its simplicity, PUE can be a confusing figure. It may be manipulated or used unfairly in comparisons.
Driven by rising energy costs, strong customer demand for sustainability, and regulations like the EU’s Energy Efficiency Directive, PUE is evolving as a metric. It is transforming from a marketing benchmark into a hard, publicly scrutinised KPI that has direct and significant consequences for operational costs, tenant acquisition, and competitive survival. For data centre operators, understanding how to master, manage, and market a verifiable PUE is no longer just about engineering excellence; it is a strategic imperative for winning in an increasingly transparent market.
PUE as a Direct Indicator of Operational Excellence and Cost Control
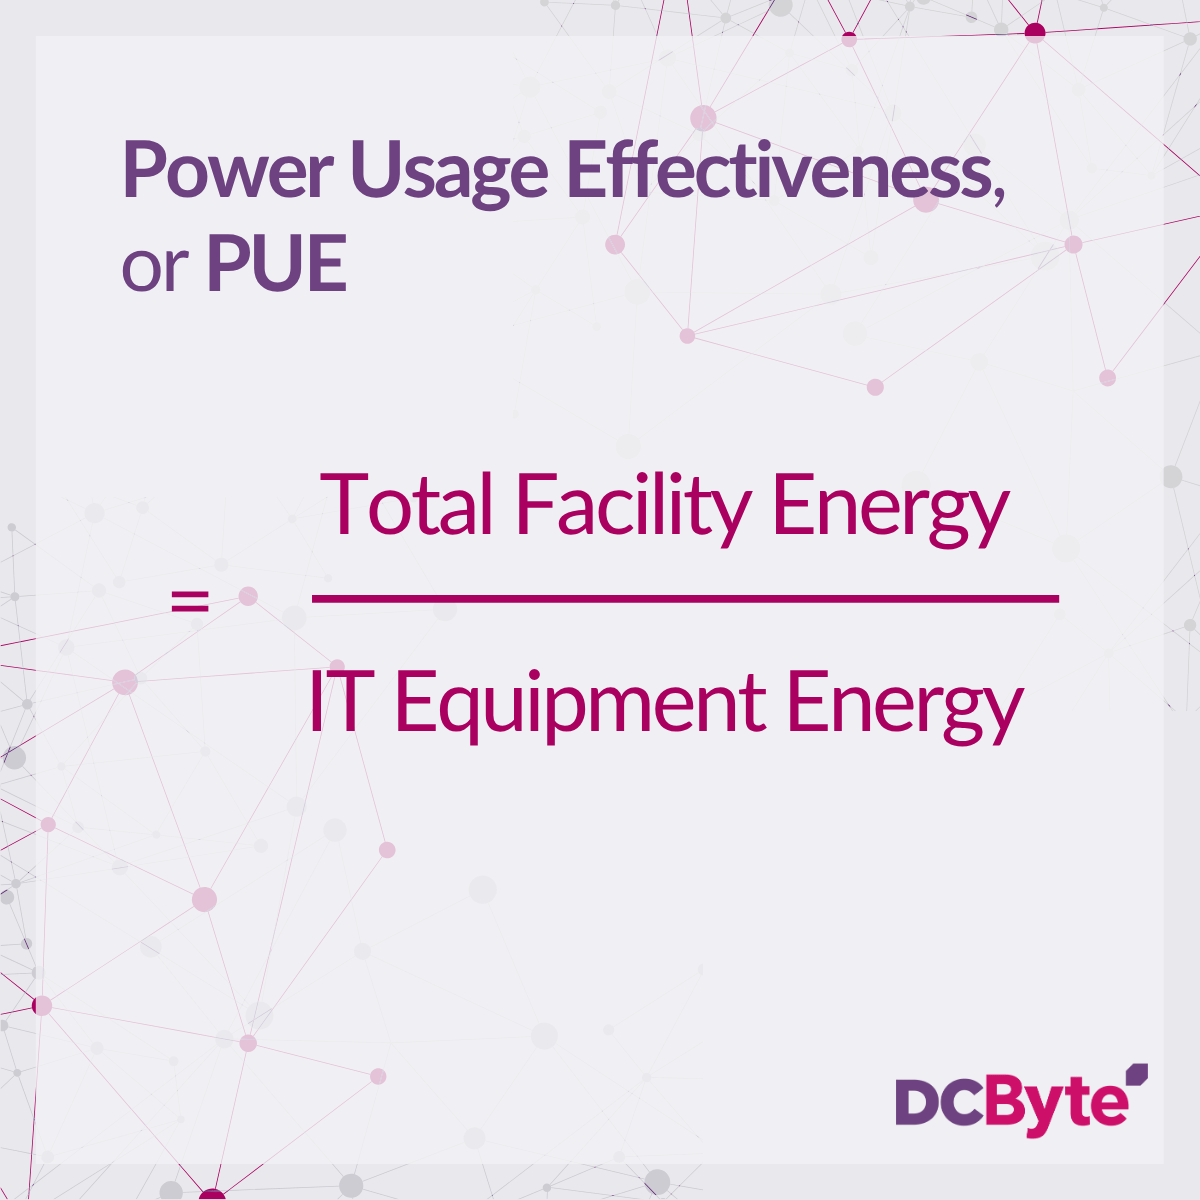
At its core, PUE (Total Facility Energy / IT Equipment Energy) is a measure of how efficiently a data centre uses energy. It reveals how much power is consumed by overheads like cooling and power distribution for every unit of energy that powers the revenue-generating IT equipment. This overhead is a direct and significant line item on the operational expenditure (OpEx) sheet.
Consider a facility with 10MW of IT load:
- A PUE of 1.6 means 16MW total energy use, with 6MW going to overheads.
- A PUE of 1.3 means 13MW total, with only 3MW to overheads.
That 3MW difference, running continuously, saves over 26 million kilowatt-hours a year. At a power cost of $0.15 per kilowatt-hour, that equates to around $1.3 million saved annually. With today’s volatile energy prices, that number could climb significantly.
For an operator, this is not just a cost-saving measure; it is a powerful competitive advantage. It allows for more aggressive pricing, higher profit margins, and the ability to reinvest savings into innovation.
Design PUE vs Operational PUE
One area where confusion often arises is the difference between design PUE and operational PUE. Design PUE assumes full utilisation, optimal environmental conditions, and maximum efficiency. But few data centres operate at those levels consistently in real-world situations.
Newly built data centres often experience ramp-up periods, where server halls are not yet fully leased. Retail colocation facilities, in particular, face regular churn and vacancy. These business realities mean operational PUE is typically less efficient than the design target. Some operators may opt to showcase the design PUE, but this may not reflect actual performance.
Conversely, operational PUE offers the clearest picture of data centre efficiency, as it reflects real-time energy use rather than theoretical conditions. It captures live operational factors and uncovers inefficiencies, making it a more transparent and meaningful metric for facility performance. However, because it often results in a higher figure than design PUE, based on full utilisation and ideal cooling conditions, some operators may prefer to promote the lower, design-based number. This is particularly common in colocation environments, where customer behaviour significantly affects overall performance. A fully leased data hall can still report high operational PUE due to underused or inefficient tenant workloads. In such cases, where operators cannot control how clients consume resources, design PUE may serve as a fairer benchmark for assessing infrastructure efficiency.
Why Context Matters in PUE Comparison
PUE is not a one-size-fits-all comparison. Climate, regional infrastructure, and cooling strategies all play a role.
For example, free cooling is abundant in Northern Europe, particularly in Nordic markets such as Sweden, along with DACH markets Austria and Switzerland. Meanwhile, data centres in the Middle East and Southeast Asia must rely on energy-intensive cooling systems. Comparing PUE scores between facilities in Oslo and Riyadh without that context is misleading.
PUE can be kept low through solutions such as open-loop adiabatic cooling, but this approach consumes a significant amount of water. In water-scarce regions, it may reduce energy use at the expense of greater environmental harm. The inverse is also true: some sustainability initiatives, like heat reuse, can increase a facility’s PUE, as venting heat into the atmosphere is prima facie more efficient than providing it to heat networks. As a result, operators may be discouraged from implementing environmentally positive solutions because of how they impact PUE figures. Organisations such as the EUDCA are now working closely with regulators to ensure that PUE calculations fairly account for these broader sustainability efforts.
From Marketing Claim to Mandated KPI
Historically, customers had few ways to verify an operator’s PUE claim. Figures could be cherry-picked from ideal conditions and presented as standard.

“For a long time, PUE was a number you put on a slide deck,” says Edward Galvin, Founder of DC Byte. “It was important, but its value was diluted because there was no standardised, mandatory reporting. An enterprise customer had no way to truly compare the efficiency of two competing facilities. The EU’s Energy Efficiency Directive has completely changed the game. By forcing public disclosure, it transforms PUE from a marketing claim into an auditable, verifiable performance metric. It’s now a number that has real commercial and reputational consequences for operators. The challenge for operators is that reporting PUE without context is something of a blunt instrument and could lead to a false impression for prospective customers”
Mandatory, public reporting has raised the stakes. With the upcoming EU database, enterprise customers can compare real operator performance. A verified PUE will become a required line item in every RFP, and those without a credible figure will be at a serious disadvantage.
The Stranded Asset Threat: PUE as an Indicator of Future Readiness
A poor PUE figure today could mean much more tomorrow. It can indicate whether a facility is fit for future demands, such as AI workloads or liquid cooling requirements. Older, air-cooled facilities with high PUEs may be physically incapable of supporting these high-revenue workloads, regardless of how much power is available.
Our data shows that approximately 40% of the data centres in the FLAP-D markets were built before 2010. These legacy assets, often with PUEs above 1.8, face the greatest risk. They will struggle to attract premium AI and hyperscale tenants and will be forced to compete for lower-density, lower-margin workloads. For an operator, a portfolio with a high concentration of these assets represents a significant long-term commercial risk.
The Intelligence Layer: Context is King for Competitive Advantage
The public PUE database will provide a new layer of raw data, but data without context is not intelligence. A sophisticated operator needs to understand the “why” behind the numbers to build a winning strategy.
“PUE is a vital starting point, but it’s just one data point in a much larger mosaic,” notes Siddharth Muzumdar, Research Director at DC Byte. “A truly informed operator needs to benchmark their performance with deep context. Our platform allows clients to correlate their facility’s PUE with other critical operational factors. For instance, we can show you two data centres with a PUE of 1.4, but our data will also show that one is located next to a major renewable energy source and has access to a district heating scheme for waste heat reuse, while the other does not. That context completely changes the competitive landscape. In the London market, where there are over 210 operational data centres, simply knowing your PUE is not enough. You need the full intelligence picture to understand your true position.”

This intelligence layer is what separates a standard operator from a market leader. Correlating PUE with competitor benchmarks and broader market context such as location, supply, demand and selected technical specifications helps operators place performance data in the right strategic frame.
For data centre operators, PUE has transcended its engineering origins. It is now a hard commercial metric, a critical tool for sales and marketing, and a powerful indicator of a facility’s operational excellence and future readiness. In the increasingly transparent and competitive data centre market, it is a metric that no operator can afford to ignore.


